Misleading bar charts: check where the scale starts
Before comparing bar heights, read the bottom of the value axis. Cutting off the base can exaggerate a difference even when the numbers above the bars are correct.
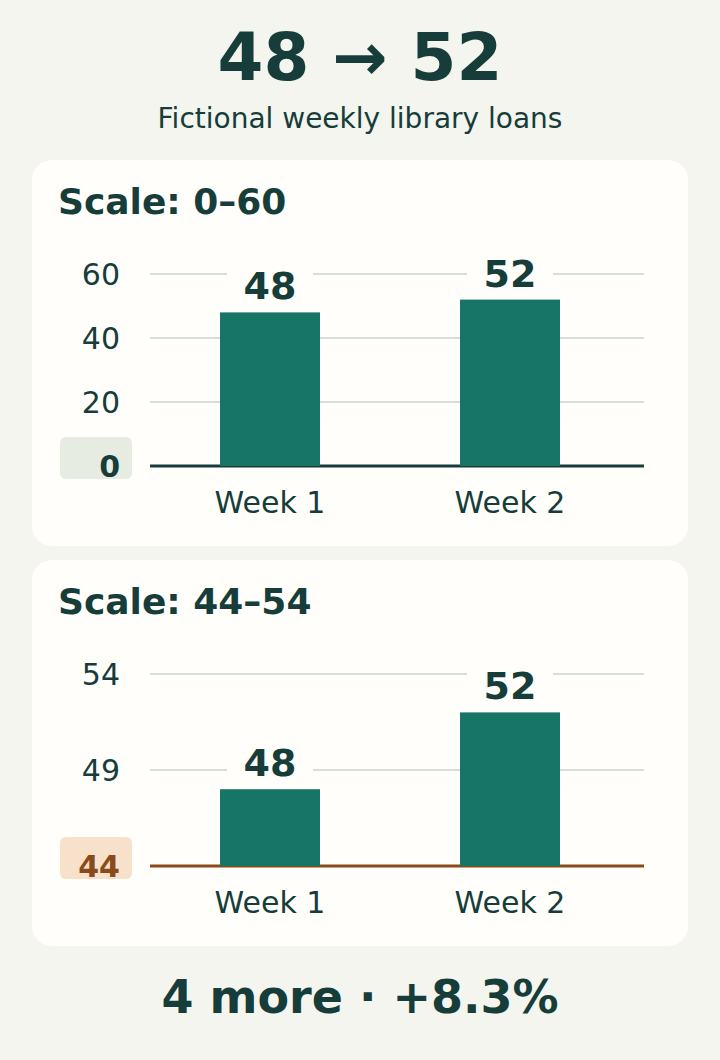
Two charts, exactly the same numbers
Imagine a small library recorded 48 loans in one week and 52 in the next. These are invented teaching data, not a report about a real library. Both charts show those same values.
In the upper chart, the value axis begins at 0. In the lower chart, it begins at 44. Read the axis labels before judging how much the number of loans changed.
What changed in the data?
There were 4 more loans. Relative to the first week, the increase was about 8.3%. The second value is about 1.083 times the first, not twice as large.
Calculate from the values
text
Difference: 52 − 48 = 4
Relative increase: (52 − 48) / 48 × 100% ≈ 8.3%
Value ratio: 52 / 48 ≈ 1.083
The first week, 48, is the denominator for the relative increase.
Why does the lower chart look so different?
A bar starting at zero has a length proportional to its value. Starting both bars at 44 leaves only 48 − 44 = 4 units and 52 − 44 = 8 units visible. Eight is twice four, so the second visible bar is twice as tall.
The two panels also use different axis ranges: 0–60 above and 44–54 below. Compare lengths within each panel, not pixel heights across panels. Enlarging the lower scale makes the gap easier to see, but it does not turn the real increase into 100%.
Correct data labels do not repair the length encoding. A visible axis break can warn that a scale was cut; it still does not make the shortened bar lengths proportional to the full values.
How to repair your own bar chart
- For an ordinary bar or column chart comparing positive amounts, set the value-axis minimum to zero. In a horizontal bar chart, this is the horizontal axis. Show negative values below or to the other side of zero when needed.
- Use one consistent scale for bars you want readers to compare. Label the measure, its units and the categories or time periods.
- Keep the exact values visible when a small difference matters. You can say “4 more loans, about 8.3% above the first week” without stretching the bars.
- If you need a closer view of similar values, consider a dot plot with a clearly labelled scale. Dots encode position; they do not imply a filled length from the edge of the chart.
Does every chart have to start at zero?
No. ONS guidance distinguishes filled bars from line charts and scatterplots. A line chart can use a narrower labelled range when the purpose is to examine variation over time. Choose a range that keeps the change in context.
Do not replace unrelated categories with a line just to avoid a zero baseline: connecting points implies an order or relationship. For categories with close values, a dot plot may be a better fit. The zero-baseline rule here concerns ordinary bars representing amounts; a chart explicitly showing intervals is a different design.
A quick check before sharing
- What does one bar measure: a count, a rate or something else?
- Where does the value axis begin, and are its steps evenly spaced?
- What do subtraction and division of the labelled values actually give?
- Are the definitions and periods comparable? A zero baseline cannot fix missing context or an unfair comparison.
Try another pair
Read the values and calculate the change. The explanations are also available without JavaScript.
Answers and explanations
- 100%: That compares the visible heights: 12 / 6 − 1 = 100%. The count itself rose from 120 to 126.
- 5%: Yes. The increase is 6, and 6 / 120 × 100% = 5%.
- 6%: Six is the absolute increase. Divide by the starting count of 120 to get the percentage.
Answer and takeaway
The increase is 6, or 5% of 120. “The bar is twice as tall” describes the cropped drawing, not the increase in the count. Read the scale, check the values, then decide whether the visual comparison supports the sentence beside it.