Relative frequency vs probability: why 12 heads in 20 flips is not a 60% chance
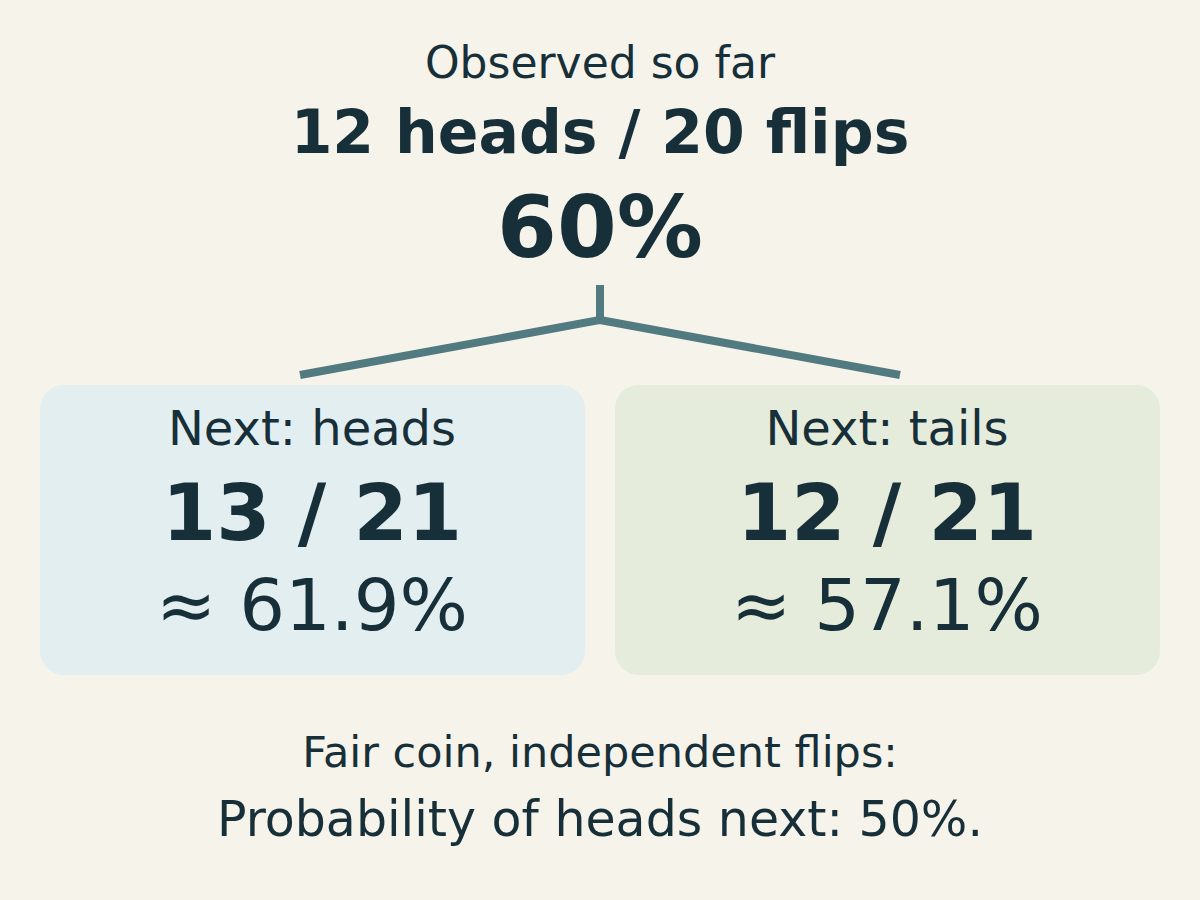
Twelve heads in 20 flips gives an observed relative frequency of 60%. In a model of a fair coin with independent flips, the probability of heads on the next flip is still 50%. The two fractions answer different questions.
What happened, and what the model predicts
Relative frequency = number of times an event occurred ÷ number of trials. Here the event is “heads”: 12 ÷ 20 = 0.6 = 60%. This describes the recorded flips.
Probability belongs to a model of the process. For a fair coin, the model gives heads and tails equal probability: 1 ÷ 2 = 50%. Independence adds a separate assumption: previous outcomes do not change the probability on the next flip.
“Favourable outcomes ÷ all outcomes” gives a theoretical probability only when those outcomes are equally likely. A coin having two sides is not, by itself, proof that a real tossing method is fair.
One more flip can move the frequency away from 50%
Start with 12 heads in 20 flips. If the next result is heads, the tally becomes 13 out of 21: about 61.9%. That is farther from 50% than 60% was. If the next result is tails, it becomes 12 out of 21: about 57.1%.
These are two possible continuations of a constructed teaching example, not results of an experiment run by Coru. They show why a growing sample does not have to move closer to the model probability at every step.
The coin does not owe you tails
Under the fair, independent model, a run with more heads does not make tails more likely on the next flip. Expecting the coin to “make up” for earlier results changes the model without evidence.
The law of large numbers says that, for independent repetitions with the same event probability, the relative frequency approaches that probability in a precise long-run sense. It does not promise an exact 50–50 split after 100 flips, or steady improvement after every flip.
A useful calculation: suppose the next 80 flips after our initial 20 happen to contain 40 heads. The full tally is then (12 + 40) ÷ (20 + 80) = 52%. The early imbalance has less weight even though the later block has exactly equal numbers. This is a hypothetical continuation, not a prediction that the next 80 must split evenly.
Keep a cumulative tally you can check
- Before starting, choose the total number of flips: for example, 100, with a checkpoint after 20. A round number is convenient, not a guarantee of accuracy.
- Choose a consistent tossing method and define what to do if a coin lands on its edge or leaves the tray. Count valid outcomes in order; do not discard ordinary heads or tails because the running percentage looks inconvenient.
- Record heads as 1 and tails as 0. After each valid flip, add that value to the previous heads total. Divide the running total by the number of valid flips so far.
- At 20 and 100 flips, record both the count and the percentage. Keep the full sequence so someone else can check your arithmetic. Do not repeatedly restart the activity to obtain a result close to 50%.
A three-row example for the tally
text
Flip n | Result (1=heads, 0=tails) | Heads so far H | H/n
1      | 1                        | 1              | 1/1 = 100%
2      | 0                        | 1              | 1/2 = 50%
3      | 1                        | 2              | 2/3 ≈ 66.7%
Illustrative rows, not measurements. With no flips yet, the relative frequency is undefined: there is no valid division by zero.
What you can conclude from your tally
Your observed fraction estimates the probability of heads only insofar as the observations represent the process you want to describe. Changing the coin, tossing method or recording rule can change that process.
A result such as 60% does not automatically establish that a coin is biased, and a result close to 50% does not prove fairness or independence. This short activity is a way to see variation and check a calculation; it is not a statistical test of the coin.
In everyday reporting, include the counts: “12 of 20” tells readers more than “60%” alone. If the true probability is unknown, report the observed proportion as an estimate instead of presenting it as an exact probability.
Check your interpretation
For the stated fair, independent coin, the next-flip probability of heads stays 50%. An additional head changes the observed proportion to 13/21 ≈ 61.9%.
Answers and explanations
- Heads still has a 50% chance next; one more head makes the tally about 61.9%.: Yes. The next-flip probability and the cumulative observed fraction are different quantities.
- Tails is now more likely because the coin must restore the balance.: Independence rules out this catch-up effect. The earlier imbalance does not change the next-flip probability.
- The probability of heads is now exactly 60%.: 60% describes this sample. It does not replace the stated 50% model probability.